1. The Dividend Snowball Effect: Compounding Mechanics
Warren Buffett famously likened compound interest to rolling a snowball down a long, snowy hill: "Life is like a snowball. The important thing is finding wet snow and a really long hill." In equity investing, the wettest snow imaginable is the Dividend Snowball Effect.
When an investor purchases shares in dividend-paying corporations or broad dividend ETFs (such as SCHD or VOO), they receive cash distributions directly into their brokerage account every quarter or month. Instead of sweeping that cash to a checking account, a Dividend Reinvestment Plan (DRIP) automatically converts those dollars into additional fractional shares at the prevailing market price.
Crucially, those newly acquired fractional shares immediately begin generating dividend payments of their own during the subsequent payment cycle. When you combine this automated reinvestment with high-quality corporations that raise their dividend payouts annually by 7% to 12% (Dividend CAGR), the math transitions from simple geometric progression into an exponential flywheel.
🌀 The Three Dual Engines of the Snowball
- Engine 1 (Organic Share Accumulation): Dividends automatically buy more shares every 90 days without taking a single cent from your salary.
- Engine 2 (Dividend CAGR Expansion): Quality companies raise their dividend per share (DPS) every year to combat inflation, increasing your yield on cost.
- Engine 3 (Capital Price Appreciation): As company earnings and cash flows grow, the underlying share price appreciates, boosting total portfolio net worth.
2. The Core Mathematics of DRIP & Quarterly Compounding
Unlike simplistic annual interest formulas (A = P(1 + r/n)nt), authentic dividend investing operates across discrete quarterly cycles where share price fluctuates and dividend payouts increase annually. The HandyTallies Snowball Engine calculates month-by-month compounding as follows:
Every month m, the share price escalates: Price(m) = InitialPrice × (r_monthly ^ m).
Where YearIndex = floor((m - 1) / 12). If starting DPS is $1.20 and growth is 8%, Year 5 DPS is $1.20 × (1.08)^4 = $1.63.
Every 3rd month, the total quarterly distribution is divided by the prevailing share price, automatically expanding your total share count.
3. The Crossover Tipping Point: Dividends Exceeding Savings
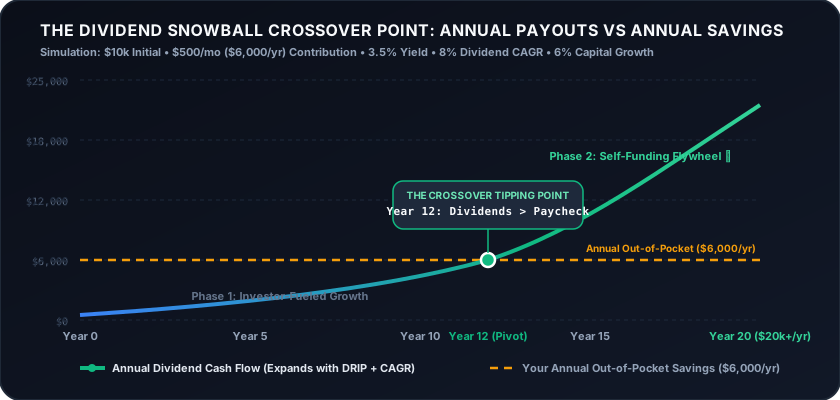
In every dividend snowball journey, there is a singular psychological milestone that changes an investor's perspective forever: The Crossover Point.
During the early accumulation years, your active paycheck does almost all the heavy lifting. If you invest $500 per month ($6,000 per year), your $300 in annual dividends feels like a drop in the ocean. However, because dividends reinvest and payouts expand, annual dividends rapidly climb to $1,000, then $3,000, then $5,000.
Around Year 11 to Year 13 for a typical dividend growth investor, your annual dividends surpass your $6,000 annual out-of-pocket savings. At this exact tipping point, your money works harder than you do. Even if you lost your job or stopped contributing personal savings, the portfolio's organic reinvestment engine would deposit more fresh capital into new shares each year than your active job ever did!
4. The 4 Chronological Phases of Snowball Growth
The psychological experience of building a dividend snowball follows four distinct operational phases:
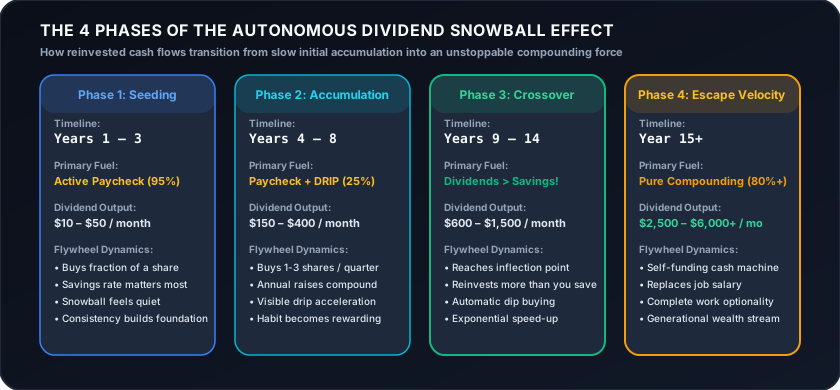
Phase 1: Seeding (Years 1 to 3): Your portfolio produces modest dividends ($10 to $50/month). Reinvestment buys fractional slivers of shares. Patience and consistency are paramount.
Phase 2: Accumulation (Years 4 to 8): Dividends now automatically buy 1 to 3 whole new shares every quarter without touching your wallet. The snowball begins visibly gaining momentum.
Phase 3: The Crossover (Years 9 to 14): Annual dividends equal or exceed your entire annual savings budget. Compounding transitions from linear to vertical exponential growth.
Phase 4: Escape Velocity (Year 15+): The portfolio produces thousands of dollars per month in hands-free cash flow. You achieve total financial sovereignty where monthly dividends fully cover your mortgage, living expenses, and lifestyle desires.
5. Dividend Yield vs Dividend Growth (CAGR): Avoiding Yield Traps
The most common trap for beginner dividend investors is chasing ultra-high starting yields (e.g. 10% to 15% yields). In finance, abnormally high yields are almost always yield traps—the result of a collapsing share price, unsustainable payout ratios (>100% of free cash flow), or destructive return-of-capital distributions.
| Investment Strategy | Starting Yield | Dividend Growth (CAGR) | 15-Year Yield on Cost | Capital Appreciation Risk |
|---|---|---|---|---|
| Yield Chaser (Trap) | 11.0% | -2.0% (Cuts) | 8.1% | Severe share price erosion |
| Dividend Growth (SCHD) | 3.5% | +8.5% | 14.8% | Strong capital growth (+6%/yr) |
| Broad Market (VOO) | 1.3% | +7.0% | 4.2% | Maximum portfolio balance |
A sustainable 3.5% dividend growing at 8.5% annually will dramatically out-compound an 11% stagnant yield over a 15-year horizon, while protecting your principal from catastrophic capital loss.
6. Yield on Cost (YOC): The True Indicator of Wealth
Financial media quotes current market yields based on today's stock price. But for a long-term compounder, the only metric that reflects your personal cash return is Yield on Cost (YOC):
Consider Warren Buffett's investment in Coca-Cola (KO). Berkshire Hathaway invested $1.3 billion into Coca-Cola in 1988. In 2024, Coca-Cola paid Berkshire approximately $776 million in annual dividends. Buffett's personal Yield on Cost on his Coca-Cola shares exceeds 59% per year! Every two years, Coca-Cola returns more than 100% of Berkshire's original purchase price in pure, unencumbered cash flow.
7. Asset Allocation Profiles: SCHD vs VOO vs JEPI vs O
Our calculator includes four benchmark presets to model different dividend philosophies:
3.5% yield + 8.5% dividend CAGR. Screens top 100 dividend-paying U.S. firms with high return on equity (ROE) and low debt. Provides optimal blend of growing cash flow and solid capital appreciation.
1.3% yield + 6.5% dividend growth. Lower cash income in the early years, but provides superior capital appreciation by capturing high-growth tech giants (Apple, Microsoft, Nvidia).
7.5% yield + 1.5% dividend growth. Uses equity-linked notes (ELNs) to write out-of-the-money call options. Ideal for retirees needing instant monthly cash flow, but sacrifices long-term dividend growth.
5.2% yield + 3.5% dividend growth. Commercial real estate investment trust (REIT) paying monthly dividends for over 30 consecutive years. Perfect for matching recurring monthly mortgage and utility obligations.
8. Tax Treatment: Qualified Dividends vs Ordinary Income
Taxes are the biggest friction point in taxable compounding accounts. In the United States, the IRS classifies distributions into two distinct tax buckets:
1. Qualified Dividends (IRC Section 1(h)): Paid by domestic U.S. corporations or qualified foreign corporations where you satisfy the 60-day holding requirement during the 121-day window around the ex-dividend date. Taxed at long-term capital gains rates: 0% (for single filers earning up to ~$47,000), 15% (up to ~$518,000), or 20%. Funds like SCHD and VOO pay virtually 100% qualified dividends.
2. Non-Qualified / Ordinary Dividends: Distributed by REITs (like Realty Income), business development companies (BDCs), and covered-call option funds (like JEPI). Taxed as ordinary income at your marginal federal income tax bracket (up to 37%).
9. The Psychology of the Snowball During Bear Markets
The true superpower of the dividend snowball is psychological endurance. In a traditional growth-stock portfolio, a 35% market crash (like 2008 or March 2020) induces panic because your portfolio value is visibly plummeting and your net worth feels destroyed.
For a dividend growth investor, market downturns trigger celebration rather than despair. If your ETF's share price drops by 30% while its cash dividend payment remains unchanged, your DRIP reinvestment purchases 43% more shares on every quarterly distribution! Bear markets are literally on-sale buying sprees that accelerate your arrival at the Crossover Point.
10. Frequently Asked Questions (FAQ)
Authoritative answers to common questions regarding the dividend snowball effect, DRIP mechanics, and Yield on Cost.
What is the Dividend Snowball effect and how does it work?
The Dividend Snowball effect describes the self-reinforcing compounding cycle where an investor buys dividend-paying shares, receives periodic cash distributions, and automatically reinvests (DRIP) those dividends into additional fractional shares. These new shares subsequently pay additional dividends of their own. Over time, compounded by annual dividend payout increases (dividend CAGR), the portfolio produces an exponentially growing passive cash flow stream.
What is the Dividend Snowball Crossover Point?
The crossover point (or tipping point) is the pivotal year when annual dividend payouts exceed the investor's annual out-of-pocket savings contributions. For example, if you deposit $500/month ($6,000/year), the crossover occurs when your portfolio generates more than $6,000 in dividends annually. From that moment forward, your portfolio creates more new shares autonomously than you purchase with your active job paycheck.
What is DRIP (Dividend Reinvestment Plan)?
DRIP is an automated brokerage feature that uses your quarterly or monthly cash dividend distributions to instantly purchase fractional or whole shares of the underlying security without brokerage commissions. DRIP is the mechanical engine of the dividend snowball, ensuring that zero cash sits idle and compound frequency is maximized.
What is Yield on Cost (YOC) and why does it matter?
Yield on Cost measures annual dividend income relative to the original out-of-pocket capital an investor contributed from their own pocket: Yield on Cost (%) = (Current Annual Dividend / Total Contributed) * 100. While a stock or ETF may offer an initial 3.5% yield, 10 to 20 years of consecutive dividend raises (CAGR) can expand your personal Yield on Cost to 15%, 25%, or even 40% on your original cash investment.
Why is Dividend Growth Rate (CAGR) more important than high initial yield?
A stock with a high starting yield (e.g. 9%) but zero dividend growth often signals financial distress (a "yield trap") and experiences share price decay. Conversely, a quality fund like SCHD with a moderate 3.5% initial yield that raises its dividend by 8% to 10% annually will eventually generate far more total cash flow, compound at higher Yield on Cost, and produce significant capital appreciation.
How frequently are dividends distributed in this calculator?
The calculator supports both standard Quarterly distributions (the schedule followed by 90%+ of U.S. equities and ETFs, including SCHD and VOO) and Monthly distributions (favored by covered-call ETFs like JEPI and real estate investment trusts like Realty Income).
How are dividends taxed in the United States?
In taxable brokerage accounts, dividends are classified as either Qualified or Ordinary. Qualified dividends (from established U.S. corporations and index funds like SCHD and VOO) receive preferential capital gains tax rates of 0%, 15%, or 20%. Ordinary dividends (from REITs or covered-call funds like JEPI) are taxed at your higher federal income tax bracket (up to 37%). Holding dividend funds inside a Roth IRA or 401(k) eliminates annual dividend taxes completely.
Can I retire entirely on dividend payments without selling shares?
Yes. This is the cornerstone advantage of dividend growth investing. By living purely on the natural dividend cash flow yield, retirees never have to liquidate shares into market downturns. Your share count remains fully intact, and growing corporate dividends naturally combat inflation.
What happens to the dividend snowball during a stock market crash?
Market crashes actually accelerate the dividend snowball for accumulating investors with DRIP enabled. Because share prices decline while established dividend aristocrats maintain their payouts, your reinvested dividends purchase significantly more shares at deep discounts, turbocharging your future payout capacity when the market recovers.
Does HandyTallies store my investment numbers?
No. HandyTallies executes all month-by-month compounding logic purely within your browser's local JavaScript engine. We never collect, transmit, store, or sell your starting principal, savings rate, or financial records.
Explore More Free Financial Tools
Discover our growing suite of dividend, cash flow, and investment calculators.
SCHD Dividend Calculator
Simulate monthly DRIP dividend compounding, future share price appreciation, and total cash flow for Schwab U.S. Dividend Equity ETF.
Coast FIRE Calculator
Calculate your exact Coast FIRE number, age milestone, and retirement nest egg without needing to save another dollar.
Snow Day Calculator
Estimate the odds your school closes tomorrow based on snowfall, ice accumulation, and bus safety protocols.