1. What is Inflation and How is the Consumer Price Index (CPI-U) Measured?
Inflation is the broad, persistent increase in the general price level of goods and services throughout an economy over time. As prices elevate across commercial sectors, each individual unit of currency purchases fewer real-world items—a phenomenon economists term the erosion of purchasing power.
In the United States, the primary benchmark measure of consumer inflation is the Consumer Price Index for All Urban Consumers (CPI-U), calculated and published monthly by the U.S. Bureau of Labor Statistics (BLS). The BLS surveys approximately 94,000 prices across 80,000 goods and services in 75 urban areas, organizing expenditure patterns into eight major categories: Food and Beverages, Housing (the largest component at ~34%), Apparel, Transportation, Medical Care, Recreation, Education and Communication, and Other Goods and Services.
2. Historical Purchasing Power Erosion: What Happened to the US Dollar Since 1950?
Looking backwards through historical economic cycles provides dramatic evidence of why cash cannot serve as a permanent wealth-building vehicle. In 1950, the baseline BLS CPI-U was 24.1. By 2026, that same index stands at roughly 329.4—an astounding cumulative expansion of over 1,260%.
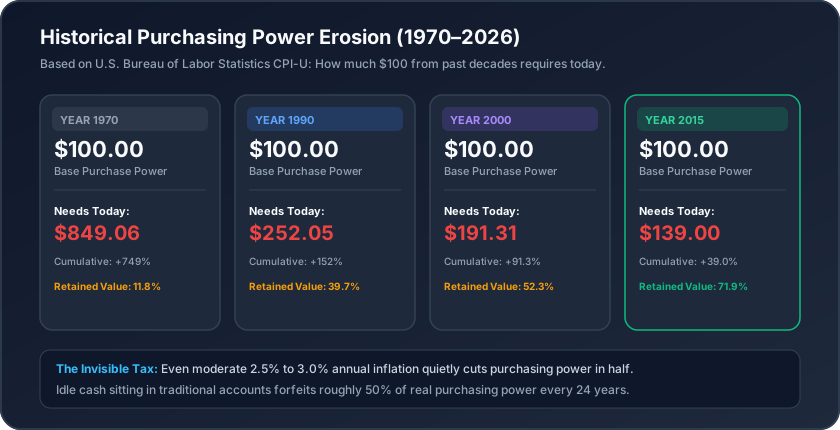
Consider a practical example: A pristine $100 bill tucked under a mattress in the year 2000 still says "$100" today. But according to official CPI data, buying that exact same bundle of groceries, clothing, and movie tickets in 2026 requires $191.31. That idle paper note lost nearly half of its real value without a single dime being physically stolen.
3. Future Cost of Living Projections: The "Silent Thief" in Retirement Planning
When individuals plan for retirement or financial independence (such as with our Barista FIRE Calculator), they often make a catastrophic mathematical error: they project future spending in today's nominal dollars.
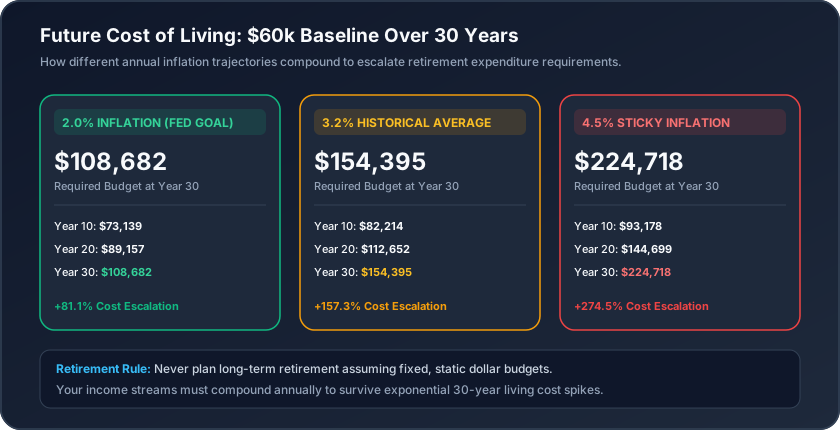
If you retire at age 60 spending $60,000 per year, and inflation averages its standard 3.2% annual rate, by age 80 you will need $112,652 per year. By age 90, you will need $154,395 per year just to eat the same meals, heat the same house, and drive the same mileage! This compounding escalation is why relying entirely on fixed-annuity income or cash deposits is dangerous without an equity dividend-growth engine like SCHD or DGRO.
4. Headline CPI vs. Real World Living Costs: The "Chart of the Century" Explained
Why do everyday citizens consistently feel that official government inflation numbers underestimate their lived experience? Because inflation does not distribute evenly across all product categories.
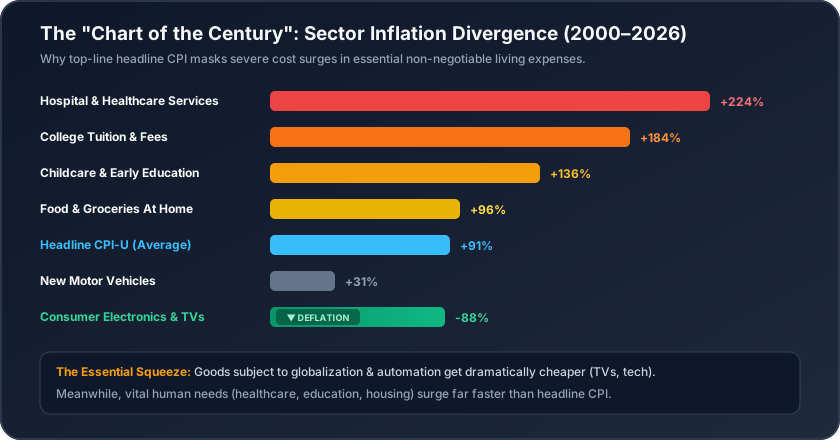
Known among macroeconomists as "The Chart of the Century" (popularized by Professor Mark Perry), the data reveals a stark division:
- Deflationary Sectors: Items subject to global manufacturing efficiencies and technological breakthroughs (smartphones, flat-screen televisions, software, computers) have experienced 70% to 90% real deflation.
- Hyper-Inflationary Sectors: Vital services that cannot be outsourced, require localized human labor, and involve regulatory licensing (hospital services, prescription healthcare, college tuition, childcare, home nursing) have skyrocketed between +136% and +224% over the same period.
Because consumers cannot skip insulin, surgery, or rent to purchase five extra 4K televisions, the effective cost of maintaining human survival rises faster than top-line index averages suggest.
5. How to Calculate Inflation: The Compound Inflation & Rule of 72 Math
Calculating future inflation requires compound arithmetic identical to interest growth, except working against you. The fundamental compound equation is:
Conversely, to compute the diminishing value of a single dollar, you invert the equation:
You can also quickly estimate how quickly prices will double using our handy Rule of 72 Calculator. Simply divide 72 by the annual inflation rate:
Cost of living doubles every 36 years.
Cost of living doubles every 24 years.
Cost of living doubles in just 12 years!
6. Asset Class Inflation Hedges: Cash vs. CDs vs. TIPS vs. Real Estate vs. Equities
How should savers protect their capital when inflation runs above historical norms? Not all asset classes respond equally to inflationary pressure.
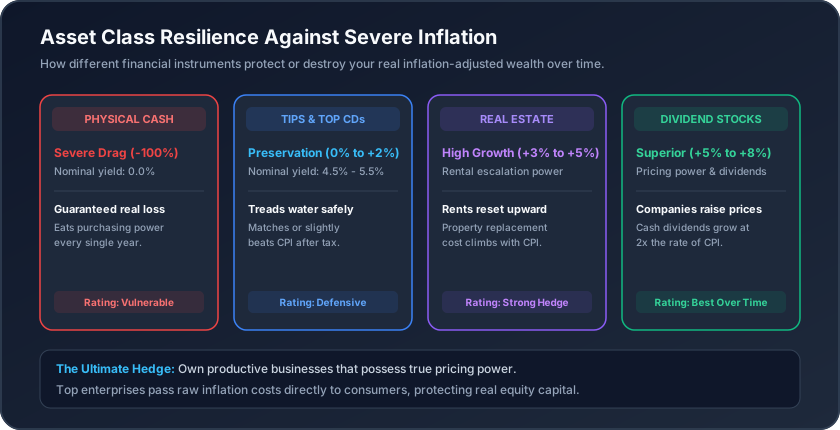
While physical cash is the most vulnerable to inflation drag, conservative instruments like high-yield Certificates of Deposit (CDs) and Treasury Inflation-Protected Securities (TIPS) safely preserve principal and match current inflation rates. For decades-long horizons, high-quality dividend growth equities historically provide the highest real return because corporations exercise pricing power, passing cost increases along to consumers while boosting dividend payouts.
7. Practical Defensive Steps to Insulate Your Household From Inflation
1. Eliminate High-Interest Variable Debt
When inflation runs hot, central banks raise benchmark interest rates. Credit card APRs spike to 25% to 30%, multiplying financing charges. Aggressively paying down revolving balances is the single highest guaranteed return you can achieve.
2. Sweep Excess Cash to High-Yield Vehicles
Never leave more than one month of operating expenses in traditional checking accounts paying 0.01% interest. Keep your 3 to 6-month safety reserve in a competitive High-Yield Savings Account (using our Emergency Fund Calculator) or a short-term CD ladder.
3. Invest in Dividend Growth Assets
Historically, dividend growth indices such as the Dow Jones U.S. Dividend 100 Index have increased their annual dividend payouts at 7% to 11% annualized—more than double historical CPI inflation—providing rising purchasing power throughout retirement.
8. Frequently Asked Questions (FAQ)
Authoritative answers to common questions regarding CPI calculations, historical inflation rates, and purchasing power preservation.
How does this inflation calculator determine historical dollar values?
Our calculator utilizes official historical Consumer Price Index for All Urban Consumers (CPI-U) data compiled and verified by the U.S. Bureau of Labor Statistics (BLS). By dividing the target year CPI by the base year CPI, the calculator determines the exact mathematical price multiplier required to replicate equivalent purchasing power across decades.
What is the historical average inflation rate in the United States?
Over the last 100 years, the average annual U.S. inflation rate has been approximately 3.1% to 3.3%. While individual years range from deflationary periods (-10% in the Great Depression) to extreme spikes (13.5% in 1980 and 9.1% in 2022), a 3.0% to 3.2% compound annual inflation assumption is the institutional benchmark for retirement and financial planning.
What is the difference between Headline CPI and Core CPI?
Headline CPI measures price changes across an entire representative market basket of goods and services. Core CPI removes food and energy prices from the calculation because commodities like crude oil, natural gas, and agricultural crops experience short-term seasonal volatility that can distort underlying macroeconomic inflationary trends.
Why does cash lose value over time if there are no physical deductions?
A $100 bill never physically loses its numeric face value. However, as the overall money supply expands and input costs (labor, transport, raw materials) climb, the quantity of real goods and services (groceries, gallons of gasoline, medical visits) that $100 can purchase shrinks continuously. This real purchasing power degradation is why idle cash guarantees an inflation loss.
How does inflation affect my retirement portfolio?
Inflation is often called the "silent thief" of retirement. At a modest 3.0% annual inflation rate, the cost of living doubles every 24 years. A retiree spending $60,000 per year at age 65 will require over $120,000 per year by age 89 just to purchase the exact same basket of living essentials. Portfolios must maintain equity exposure to outpace this cost drag.
What are the best investment assets to protect against high inflation?
Historically, the most effective long-term inflation hedges are dividend growth equities (e.g., companies with competitive pricing power), real estate and residential REITs (where lease rents escalate with CPI), and Treasury Inflation-Protected Securities (TIPS), whose principal value resets upward based on BLS inflation metrics.
Explore More Free Financial Tools
Discover our growing suite of dividend, cash flow, and investment calculators.
SCHD Dividend Calculator
Simulate monthly DRIP dividend compounding, future share price appreciation, and total cash flow for Schwab U.S. Dividend Equity ETF.
JEPI Dividend Calculator
Simulate monthly covered-call cash flow, option premium payouts, and DRIP compounding for JPMorgan Equity Premium Income ETF.
JEPQ Dividend Calculator
Calculate Nasdaq-100 covered-call dividend distributions, monthly DRIP compounding, and volatility cash flow for JEPQ ETF.
VOO Dividend Calculator
Project long-term S&P 500 compounding, quarterly dividend reinvestment, and multi-decade wealth accumulation for Vanguard S&P 500 ETF.
VYM Dividend Calculator
Forecast quarterly dividend income and DRIP compounding for Vanguard High Dividend Yield ETF across 450+ value equities.
DGRO Dividend Calculator
Simulate dividend growth, payout-ratio screened reinvestment, and long-term compounding for iShares Core Dividend Growth ETF.
VIG Dividend Calculator
Project compounding returns, 10+ year dividend streak accumulation, and quarterly payouts for Vanguard Dividend Appreciation ETF.
Coast FIRE Calculator
Calculate your exact Coast FIRE number, age milestone, and retirement nest egg without needing to save another dollar.
Dividend Snowball Calculator
Simulate the exponential dividend snowball effect, crossover tipping point, and hands-free monthly passive income stream.
Stock Average Down Calculator
Calculate new weighted average cost basis, break-even share price, and shares required to average down across multiple purchase lots.
Time and a Half Calculator
Calculate your time and a half 1.5x overtime hourly rate, double-time holiday pay, and total gross paycheck compensation.
Rule of 72 Calculator
Calculate how many years it takes for your money to double at any rate of return, and explore exponential compounding milestones.
Pay Raise Calculator
Calculate your new salary, hourly wage, and pay increase percentage across annual, monthly, and biweekly paychecks.
Barista FIRE Calculator
Calculate your Barista FIRE number, required part-time income, and milestone timeline to escape the corporate grind early.
Snow Day Calculator
Estimate the odds your school closes tomorrow based on snowfall, ice accumulation, and bus safety protocols.
Emergency Fund Calculator
Calculate your personalized 3 to 12 month survival safety net, funding gap, and annual high-yield savings interest yield.
CD Calculator
Calculate Certificate of Deposit interest payouts, maturity values, APY compounding, and rolling 4-rung CD ladder strategies.
Methodology
How we calculate this
The inflation calculator has two modes: a historical mode using the U.S. CPI-U annual averages stored in the tool, and a future mode using a constant rate you choose.
Formulas used
- Historical value
- amount × CPI(end year) ÷ CPI(start year)
- Annualized inflation
- (CPI end ÷ CPI start)^(1 ÷ years) − 1
- Future cost
- amount × (1 + rate)^years
- Purchasing power of $1
- 1 ÷ (1 + rate)^years
Step by step
- Historical mode looks up the CPI-U value for each year and scales your amount by their ratio.
- Future mode compounds your chosen inflation rate once per year.
Assumptions and limits
- Future mode assumes the same inflation rate every year.
- CPI-U is a national average; your personal inflation rate can differ.
Worked example
Computed with the same code the calculator uses. Hypothetical future-mode example with a constant 3% rate.
| Amount today | $1,000 |
|---|---|
| Years | 20 |
| Inflation rate | 3.0% |
| Cost of the same basket in 20 years | $1,806.11 |
|---|---|
| Purchasing power of $1 | $0.554 |
| Cumulative loss | 44.6% |
Related guides
- How Accurate Is the Rule of 72? Exact Doubling Times Compared min read
- Coast FIRE vs Barista FIRE: The Math Behind Each Path min read
- How to Calculate Your FIRE Number, Step by Step min read
- How Much Emergency Fund Do You Need? A Practical Formula min read
- How a CD Ladder Works: Building One Rung by Rung min read
- Real vs Nominal Returns: Adjusting Growth for Inflation min read
- How to Calculate a Pay Raise Percentage (and What It Is Worth) min read
- How to Adjust a Dollar Amount for Inflation Using CPI min read
- How Snow Day Predictors Work (and Why They Are Only Estimates) min read
- The 4% Rule and Safe Withdrawal Rates, Explained min read
- Overtime vs a Pay Raise: Which Adds More to Your Paycheck? min read
